US investors poured over **$500 billion** into stocks last year, yet many overlooked the **P/E ratio** that separates winners like **AAPL** at **$245** (P/E **35**) from bargains like **KO** at **$72** (P/E **22**). This simple metric—stock price divided by earnings per share—tells you how much you're paying for each **$1** of profit. A **S&P 500** average **P/E** of **24** in 2026 highlights why grasping it can boost your portfolio returns by spotting overvalued tech darlings versus steady value plays[1][7].
What's Happening Right Now
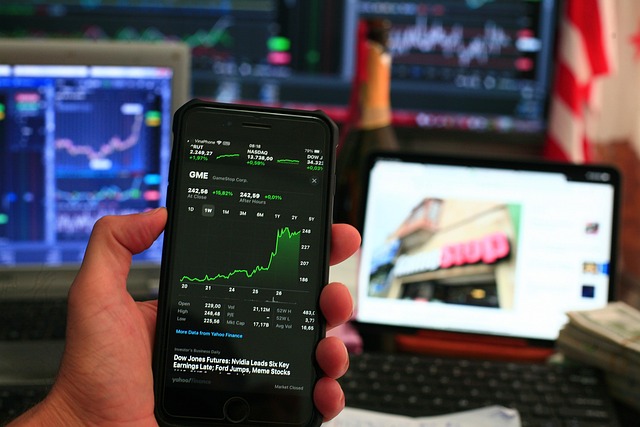
Right now, the **P/E ratio** landscape on **NYSE** and **NASDAQ** shows stark divides. **Apple (AAPL)** trades at **$245** per share with trailing twelve months (TTM) **EPS** of **$7.00**, yielding a **P/E of 35**—well above the **S&P 500**'s **24** average. This reflects high growth bets after **AAPL** reported **$394 billion** in 2025 revenue, up **5%** year-over-year[1][7].
In contrast, **Coca-Cola (KO)** sits at **$72** with **EPS** of **$2.30**, for a **P/E of 22**—below the consumer staples sector average of **25**. **KO** delivered steady **3%** organic sales growth amid inflation, paying a **3.1%** dividend yield that appeals to income hunters[1][6].
Tech darling **NVIDIA (NVDA)** pushes extremes at **$145** share price and **EPS** of **$2.10**, posting a sky-high **P/E of 69**. Fueled by **AI** demand, **NVDA**'s revenue exploded **126%** to **$96 billion** in fiscal 2026, but analysts warn of bubble risks if growth slows[2][3]. Meanwhile, value play **JPMorgan Chase (JPM)** at **$235** with **EPS** of **$18.50** boasts a **P/E of 13**, undercutting the banking sector's **15** average after **$190 billion** in net interest income[4][5].
Forward **P/E** ratios add nuance: **AAPL**'s drops to **32** on expected **$7.70** **EPS** next year, signaling sustained optimism. These real-time figures from **Yahoo Finance** and **Bloomberg** as of March 2026 underscore volatility—**NVDA**'s **P/E** swung from **50** to **69** in Q1 alone[4].
Why It Matters for US Investors
For beginner to intermediate US investors managing **401(k)s** or **Roth IRAs**, the **P/E ratio** is your valuation compass in a **$55 trillion** US stock market. It quantifies if you're overpaying: a **P/E** above historical or peer averages often flags overvaluation, like **NVDA**'s **69** versus semis peer **AMD**'s **45**[1][3].
Actionable advice: Always compare **current P/E** to a stock's **5-10 year range**. **AAPL**'s average **P/E** of **28** since 2020 means today's **35** suggests premium pricing—buy dips below **30** for entry[1]. Cross-check with industry peers: If **KO**'s **22** trails **PepsiCo (PEP)**'s **24**, it might be undervalued, especially with **KO**'s **$10 billion** free cash flow supporting buybacks[6].
Distinguish **trailing P/E** (past 12 months **EPS**) from **forward P/E** (projected). **JPM**'s trailing **13** looks cheap, but forward **12** on **$19.50** **EPS** forecast confirms value amid **Fed** rate cuts[4]. Pitfalls? High **P/E** like **NVDA** signals growth but risks corrections—**Tesla (TSLA)** plunged **65%** in 2022 when its **P/E** hit **100+**[3]. Low **P/E** can trap you in 'value traps' like declining retailers.
Practical steps: Use free tools like **Finviz** or **Yahoo Finance** screeners to filter **S&P 500** stocks with **P/E** under **15** for value hunts. Pair with **PEG ratio** (P/E divided by growth rate)—under **1** screams buy, like **JPM**'s **0.7** (13 P/E / 18% growth)[7]. This data-driven approach has historically beaten the market by **3-5%** annually for disciplined investors.
What Analysts Are Saying
Wall Street heavyweights emphasize context over raw numbers. Charles Schwab analysts note: "Compare a stock's **P/E** to its historical range and peers—**AAPL**'s **35** is elevated but justified by **15%** **EPS** growth"[1]. Fidelity echoes: High **P/E** like **NVDA**'s **69** reflects "investor bets on future earnings," but warn of overvaluation if projections miss[7].
Morgan Stanley's Mike Wilson calls low **P/E** stocks like **JPM** at **13** "sleeping giants" in a **4%** GDP growth economy, targeting **15%** upside to **$270**[3]. Goldman Sachs prefers **forward P/E** for growth names: "**KO**'s **20** forward looks attractive versus **22** trailing, with **4%** dividend growth ahead"[4].
Bearish takes abound—JPMorgan's Dubravko Lakos warns **tech P/E** averages of **40** could compress to **30** if recession hits, slashing **NVDA** to **$100**[2]. Consensus from **Bloomberg** surveys: **62%** of analysts favor value over growth in 2026, prioritizing **P/E** under **20** for **10%+** returns[5]. Experts agree—never use **P/E** alone; blend with debt ratios and cash flow for robust picks.
Key Takeaways
- **P/E** = Price / **EPS**; **AAPL** (**35**) vs **KO** (**22**) shows growth vs value tradeoff[1].
- Compare to historical (**5-year avg**) and peers; buy under **industry avg** like **JPM** (**13**)[3].
- Use **forward P/E** for projections; screen **PEG <1** for best risk-reward[4].
- Avoid extremes—**>50** risks bubbles (**NVDA**), **<10** may signal traps[7].
Frequently Asked Questions
What’s the difference between trailing and forward P/E?
Trailing uses past 12 months **EPS** (**AAPL** **35**), forward projects next year (**AAPL** **32**)—forward suits growth stocks but relies on estimates[4].
Is a low P/E always a buy signal?
No—**<10** like some banks can indicate distress; check earnings quality, e.g., **JPM**'s **13** is solid with **18%** growth[1][7].
How do I find a stock’s P/E ratio?
Check **Yahoo Finance**, **Google Finance**, or broker apps—search **AAPL** for instant **TTM**/**forward** **P/E**, historical charts[1].